Unfortunately, the predictions raised in my blog post last month about the fate of the Great Barrier Reef (GBR) in response to the ongoing mass global bleaching event have come true. Throughout March, coral reefs located on the far north section of the GBR have suffered variable but widespread bleaching.
Map of the Great Barrier Reef. The area north of Cairns is currently experiencing moderate to severe bleaching [4].
Lizard Island is located by the red star in this map. It is located about 250 km NE of Cairns [5].
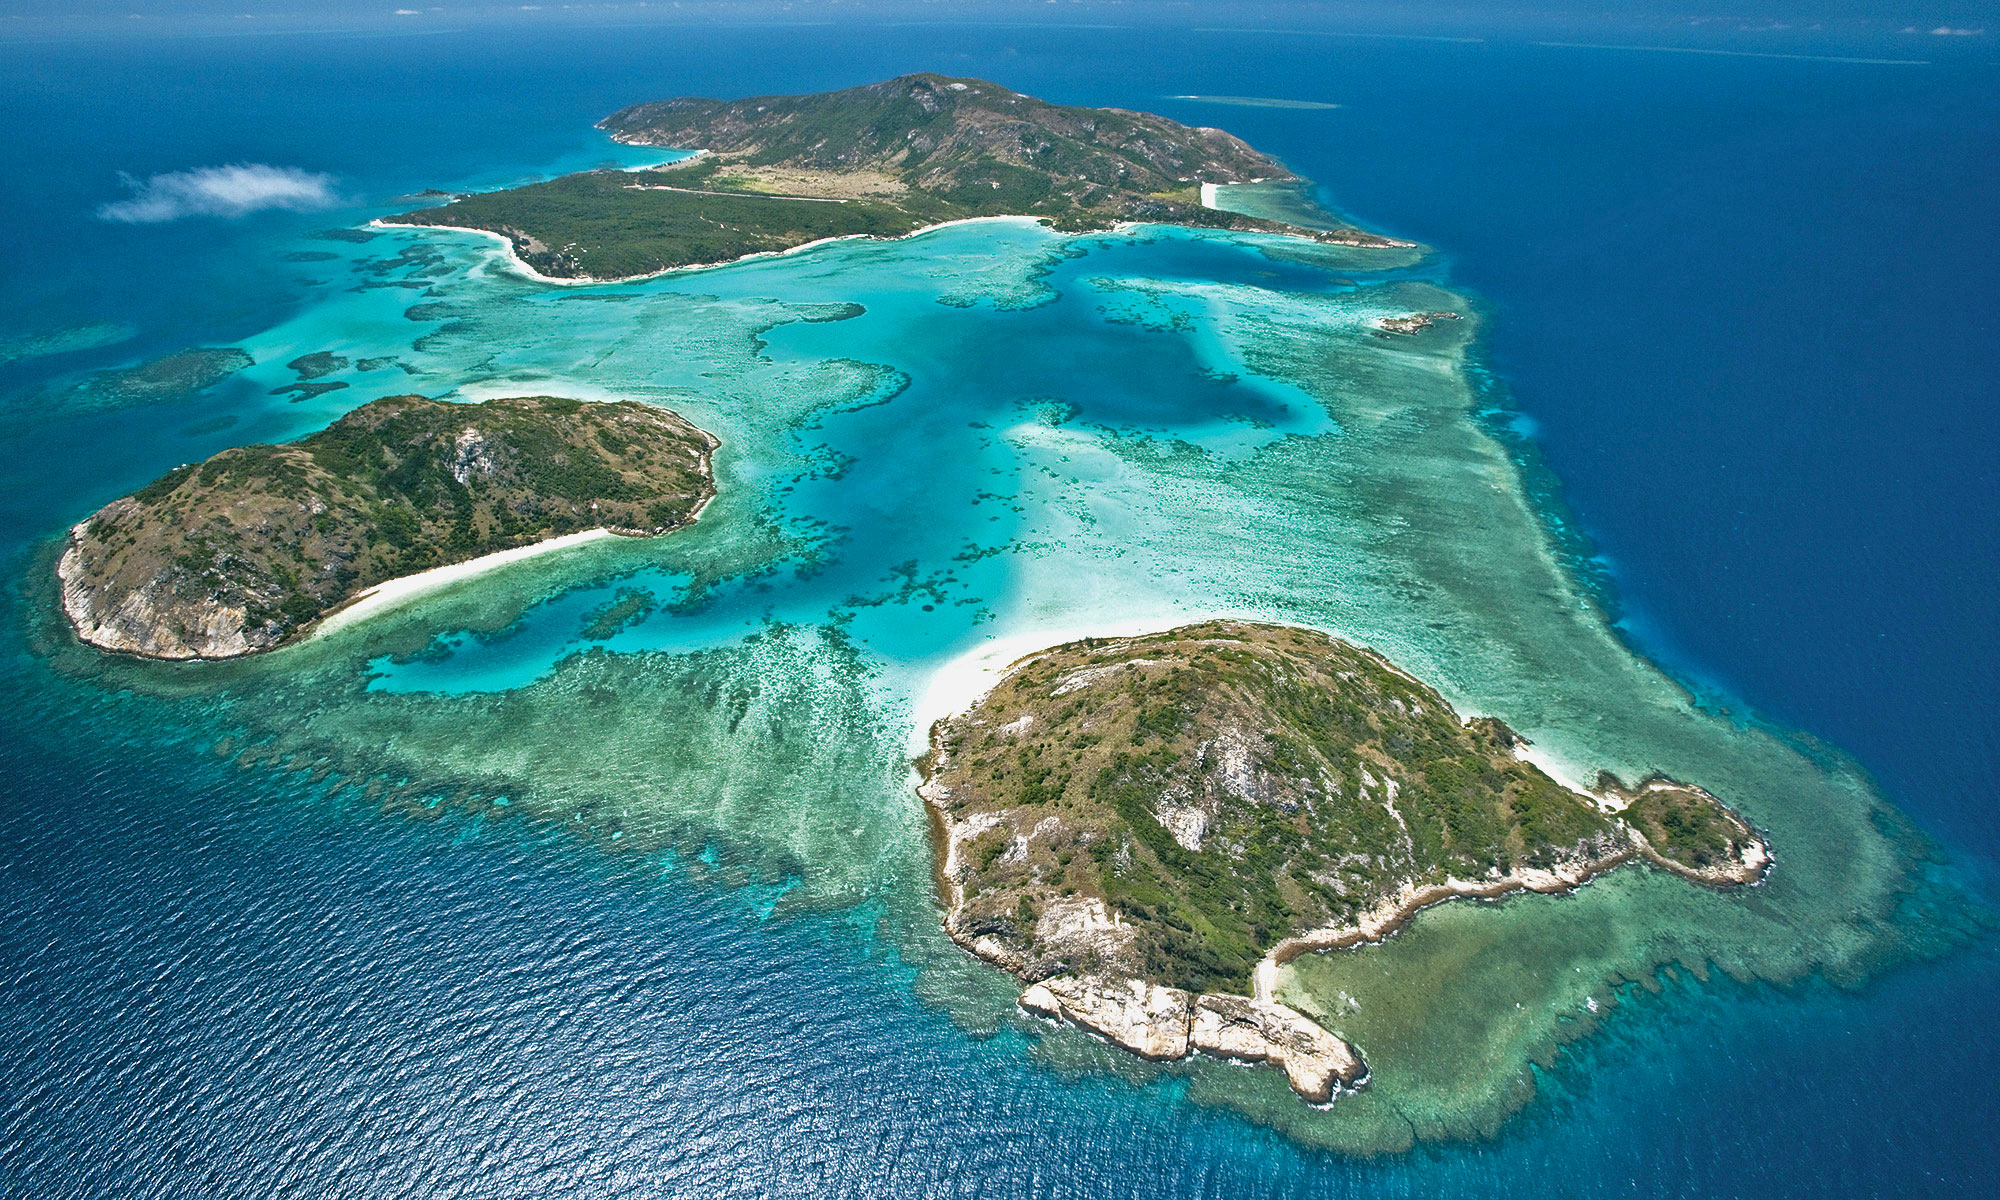
Photograph of Lizard Island. You can see the fringing reef bordering the island from above [6].
It appears that right now the far north GBR is experiencing the worse part of the bleaching event. The National Oceanic and Atmospheric Administration (NOAA) uses satellites and modeling to create Regional Coral Bleaching Thermal Stress Gauges, which provide current and future predictions of the severity of bleaching in a given area2. The most recent data on the Far Northern GBR is pictured below.
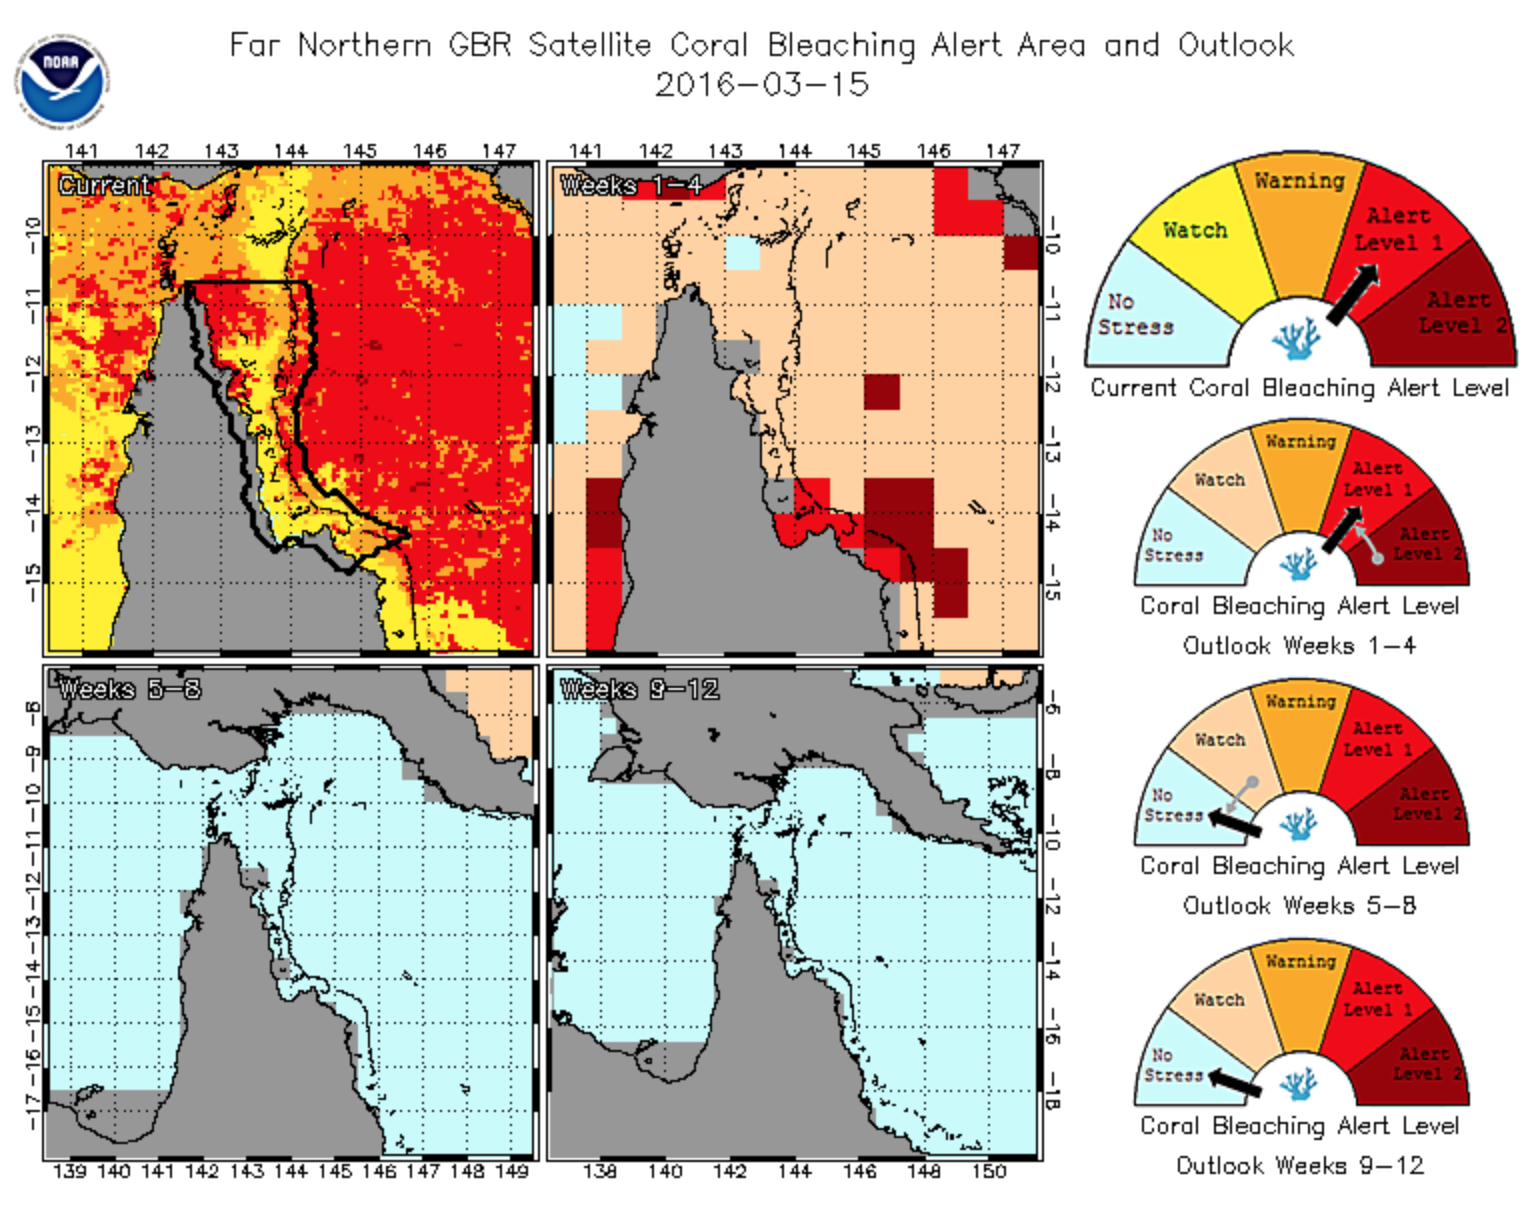
Maps and gauges representing the severity of coral bleaching in Far Northern GBR. The Maps represent the current conditions (upper left), and projections for 1-4 weeks (upper right), 5-8 weeks (bottom left), and 9-12 weeks (bottom right) out [7].
NOAA also utilized its data to create a timescale graph of the SST of the reef, pictured below.
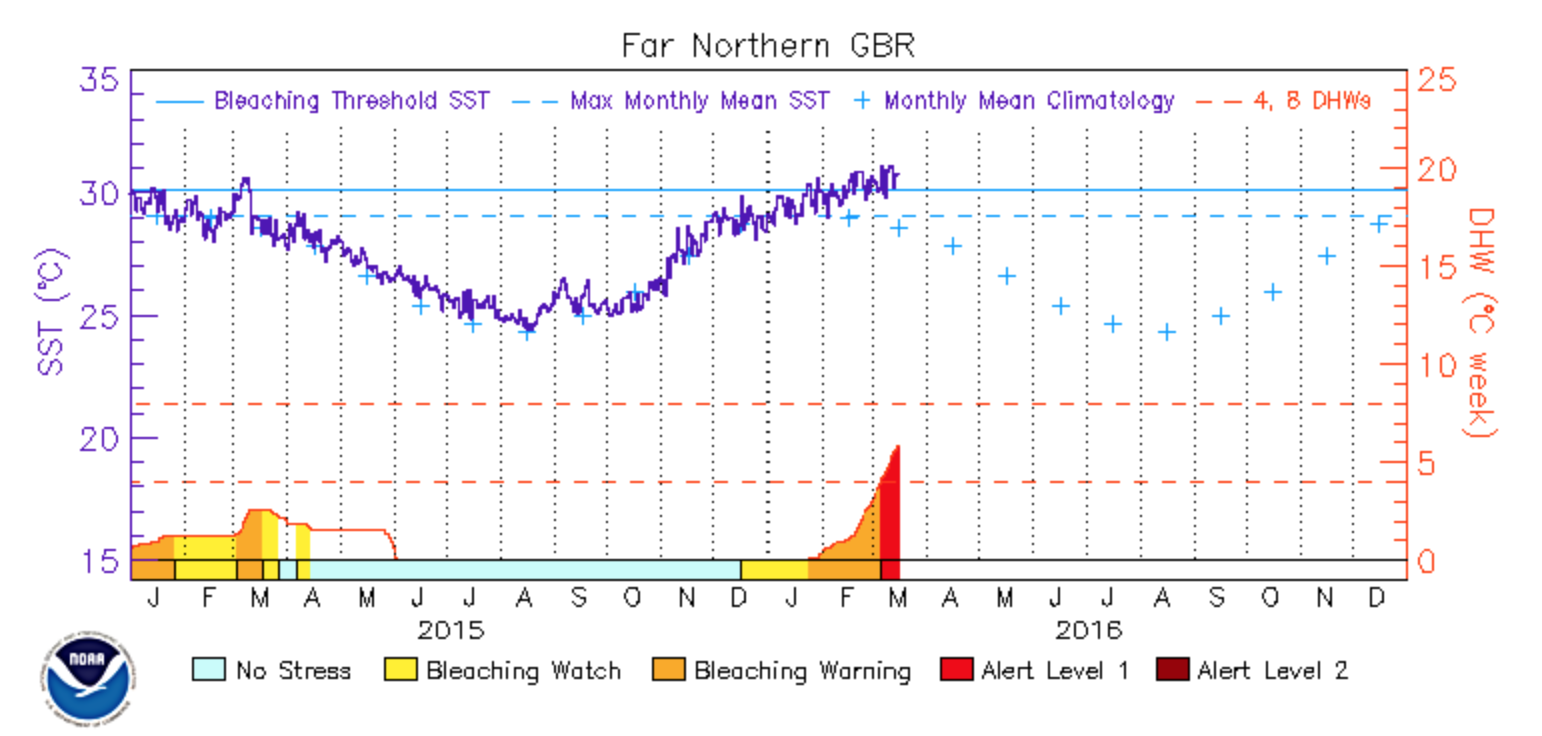
Graph of the Sea Surface Temperatures (SST) (in Celsius) in the Far Northern GBR plotted against the months over the past two years. The current period (March) indicates above average values [8].
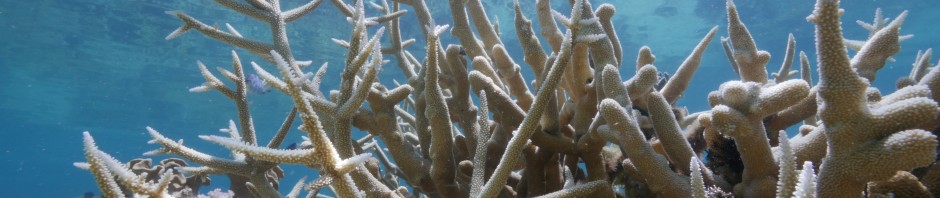
While I have not been able to find any current research papers regarding what is happening, the World Wildlife Fund (WWF) in Australia posted a video and photographs on March 1st showing the current state of a reef on Lizard Island. These are included below.
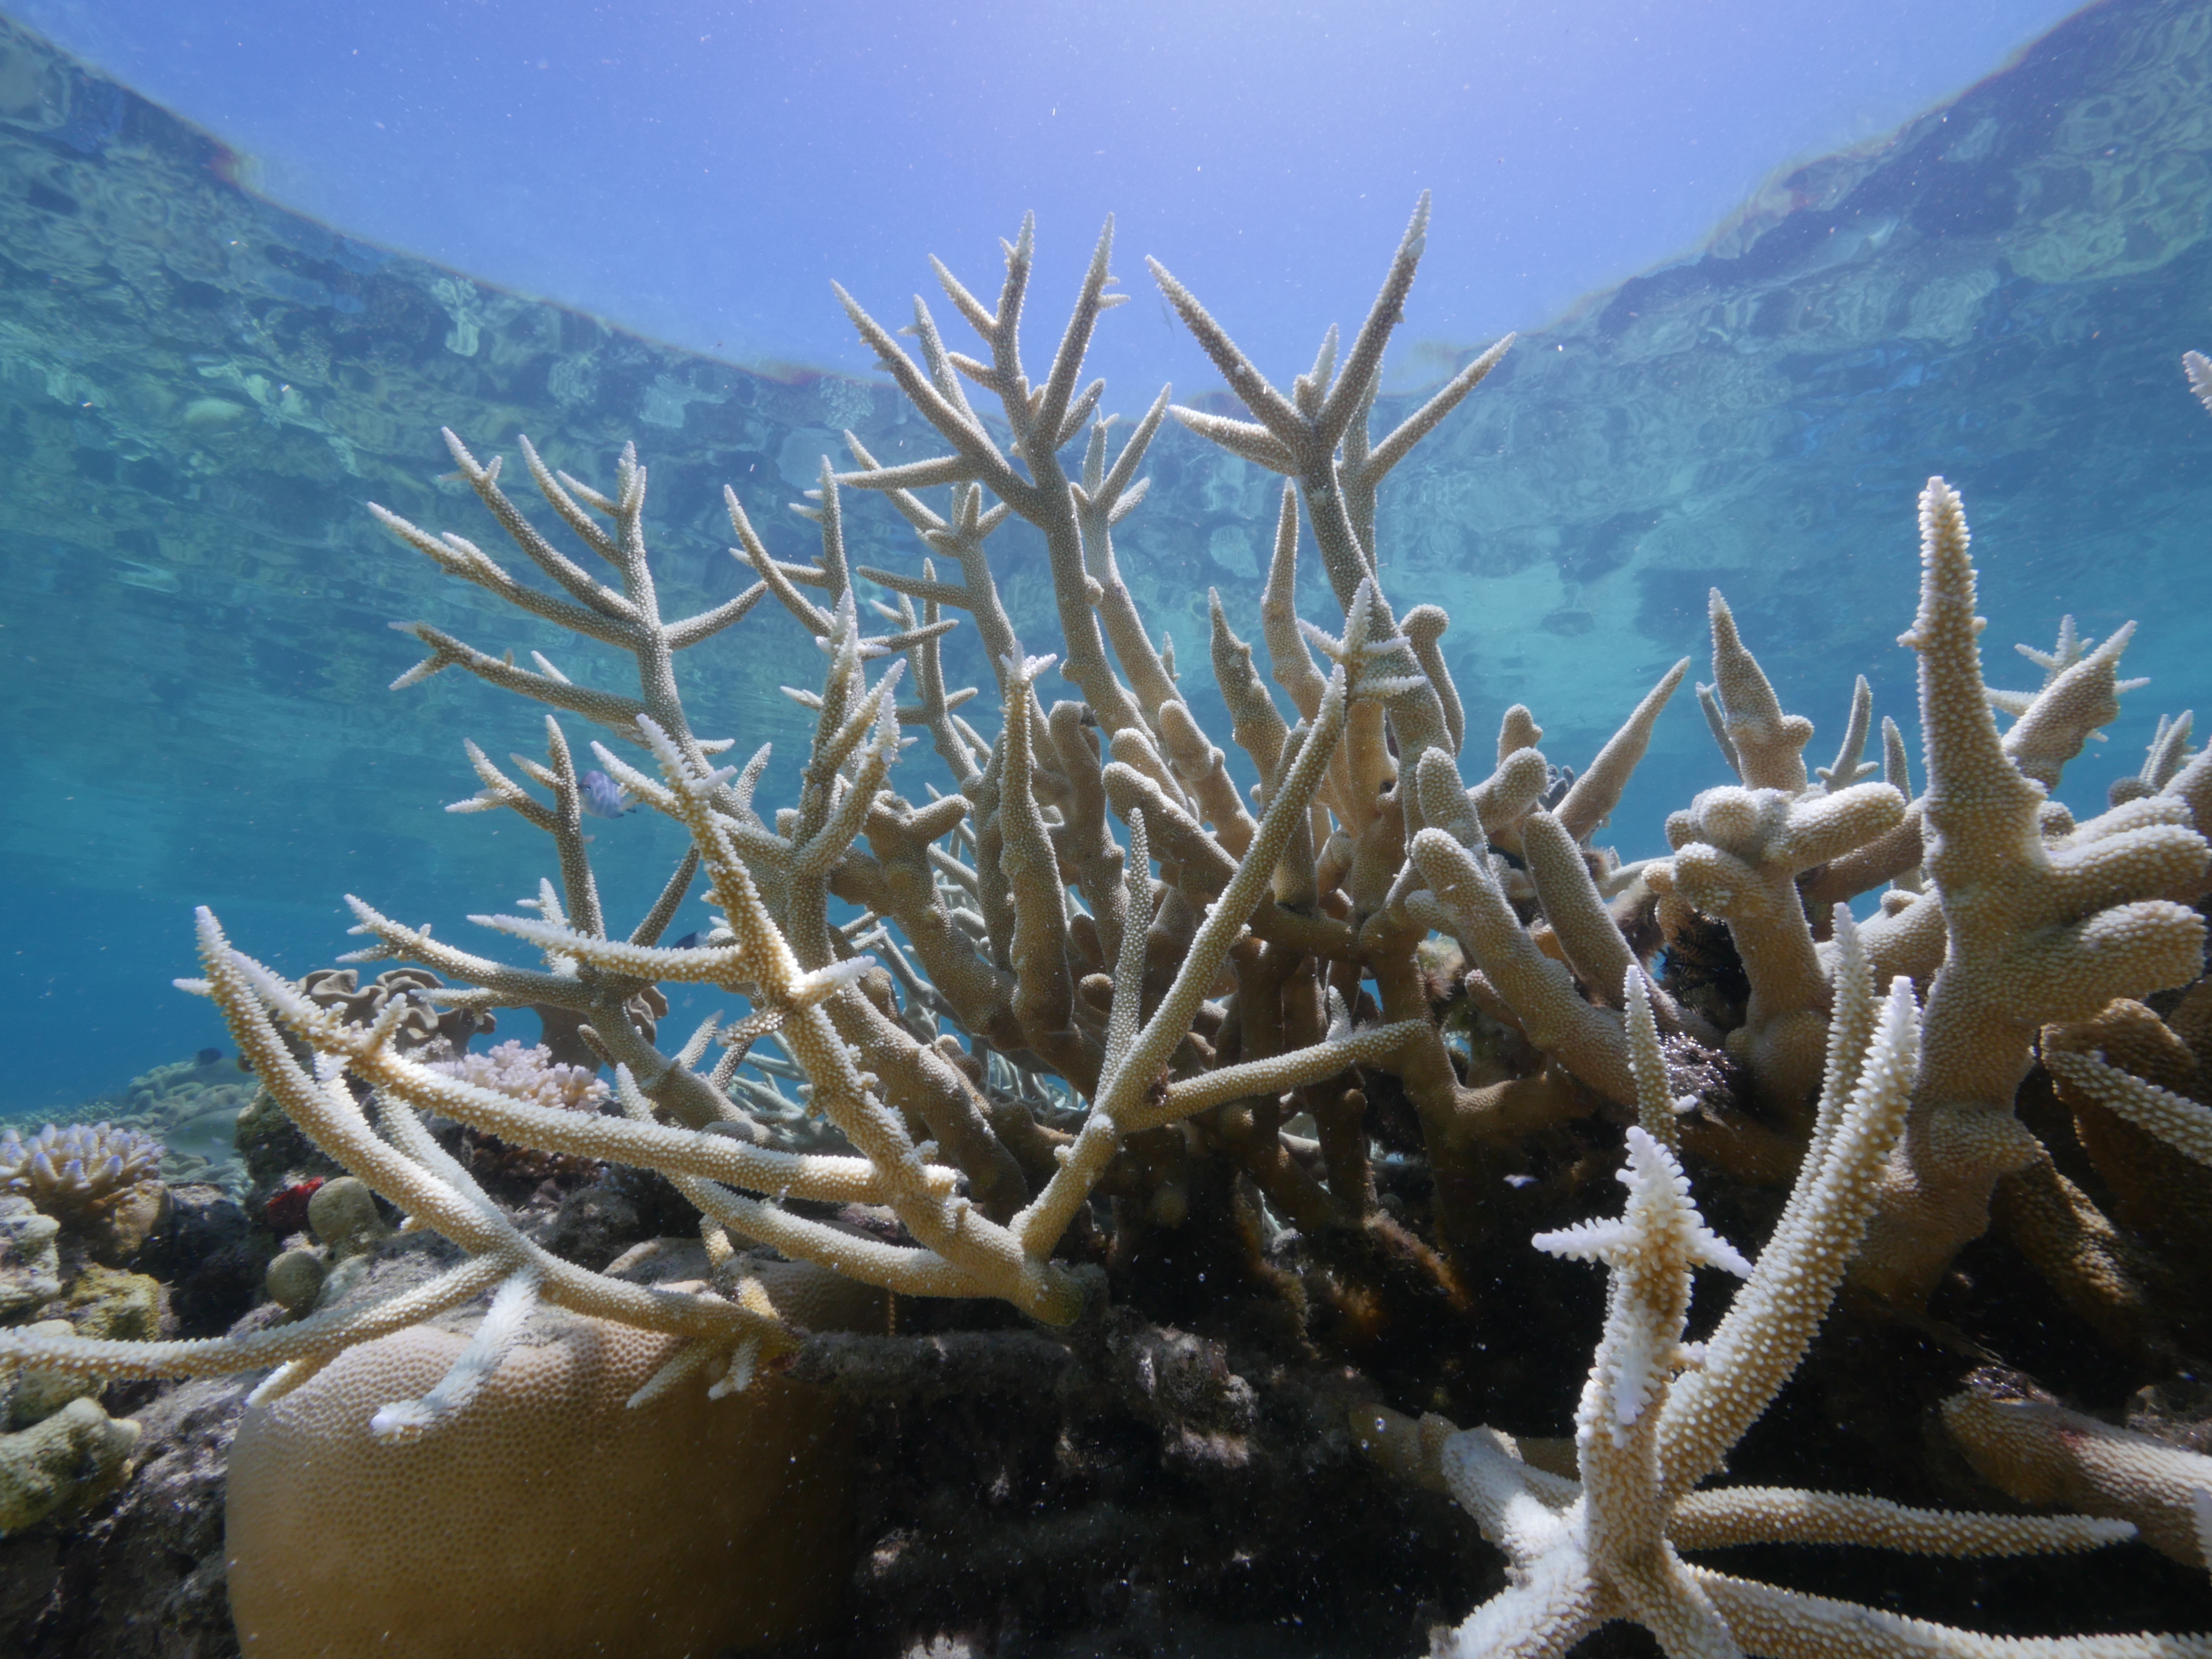
Coral bleaching, Lizard Island, Great Barrier Reef, March 2016
© WWF-Australia [9]
Time will tell what happens next in the GBR. Hopefully, the bleaching will diminish over the next few weeks and more reports will be available quantifying the severity of damage in the northern reefs. Until then, stay tuned.
References:
- “Reef coral bleaching intensifies in far north.” Great Barrier Reef Marine Park Authority. N.p. 03 March 2016. Web. http://www.gbrmpa.gov.au/media-room/latest-news/coral-bleaching/2016/reef-coral-bleaching-intensifies-in-far-north
- “Far Northern GBR 5-km Bleaching Thermal Stress Gauges.” NOAA Satellite and Information Service Coral Reef Watch.p. 15 March 2016. Web. http://coralreefwatch.noaa.gov/vs/gauges/gbr_far_northern.php
- “Coral-List Great Barrier Reef bleaching update.” Hughes, Terry. N.p. 1 March 2016. Web. http://coral.aoml.noaa.gov/pipermail/coral-list/2016-March/016625.html
Images:
- Great Barrier Reef Basin. Image. Web. N.d. http://www.mappery.com/map-of/Great-Barrier-Reef-Basin-Map
- Lizard Island, Australia. Image. Vacationstogo. Web. 2016. http://www.vacationstogo.com/cruise_port/Lizard_Island__Australia.cfm
- Lizard Island. Photograph. LizardIsland. Web. 2012. http://www.lizardisland.com.au
- Far Northern GBR Satellite Coral Bleaching Alert Area and Outlook. Image. NOAA Satellite and Information Service Coral Reef Watch. 15 March 2016. Web. http://coralreefwatch.noaa.gov/vs/gauges/gbr_far_northern.php
- Far Northern GBR. Image. NOAA Satellite and Information Service Coral Reef Watch. 15 March 2016. Web. http://coralreefwatch.noaa.gov/vs/gauges/gbr_far_northern.php
- Coral Bleaching, Lizard Island, Great Barrier Reef. Photograph. WWF-Australia. Web. 1 March 2016. http://www.wwf.org.au/?15680/Worst-coral-bleaching-on-Lizard-Island-since-2002-a-cause-for-concern
Video:
- WWF-Australia. “Coral Bleaching, Lizard Island, Great Barrier Reef.” Video. Web. 1 March 2016. https://youtu.be/isRIlXNY1Jc?list=PLtVYm_50W1qdlMhnRumj9qPovRaGPE3C8